Free to start · No card required
ASX top gainers
The largest percentage price moves on the ASX, measured at the last market close. The list covers profitable companies above a size and liquidity floor, so what you get is the movers among established businesses rather than a page of penny stocks.
Equishark provides factual information about listed securities. It is not financial product advice — see our Disclaimer.
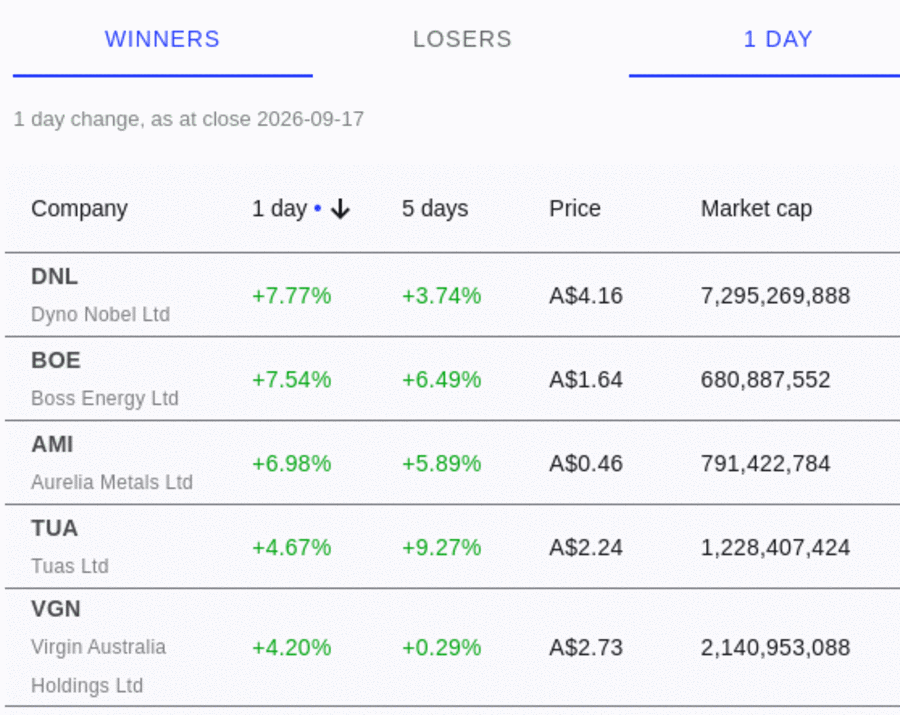
Gainers and losers, one screen
A switch flips the same table between the companies that rose furthest and the ones that fell furthest. It is one measurement read from either end, so there is nothing separate to go and find.
- 1 day change
- 5 day change
- Price
- Market cap
- Sector
- Every column sortable
A move on its own says nothing about why it happened. Every company in the list opens onto its price history, its financial statements and its metrics charted over time, so the move can be read against the company rather than on its own.
Why this list differs from other gainers pages
If you have come from a general market-movers page you will not see the same companies. That is deliberate, and worth understanding before you decide which one you want.
Percentage moves favour cheap, thin stocks
A share going from two cents to three has risen 50%; one going from $40 to $41 has risen 2.5%. And a company trading a few thousand dollars a day can be moved a long way by a single order. An unfiltered percentage ranking is therefore led by the smallest and least traded companies on the market, as arithmetic rather than as news.
So the list applies a floor
Companies are included only above a market capitalisation threshold and a 200-day average volume threshold, and only if they are profitable. The volume test uses the long-run average rather than a single day, because one day's volume is exactly what spikes on the move being shown.
Measured at the close, not live
The change is calculated from end-of-day prices for the last completed trading session, over one day by default or five days if you switch. It does not tick during market hours, and the date it was measured is shown on screen.
The price chart, company description and metric summary are free to read. The charted series and the financial statements use credits, and you are given some to start with — see pricing.
Common questions
See what moved
Open the list, sort it either way and read the companies behind the moves. No card, nothing to install.
See the biggest ASX movers