Discover
The Discover screen in Equishark: apply a stock filter, page through the companies that match it and add any of them to a Watchlist.
On this page
The ‘Discover’ section of Equishark is the place where the power of Equishark really shows up.
By using Filters you can narrow down the list of stocks you are looking at to those stocks that fit the criteria you have decided on. This greatly reduces the amount of work you need to do to identify those that interest you. Filters let you view only those stocks that you are interested in. You can either use the filters we supply by default or create your own filters.
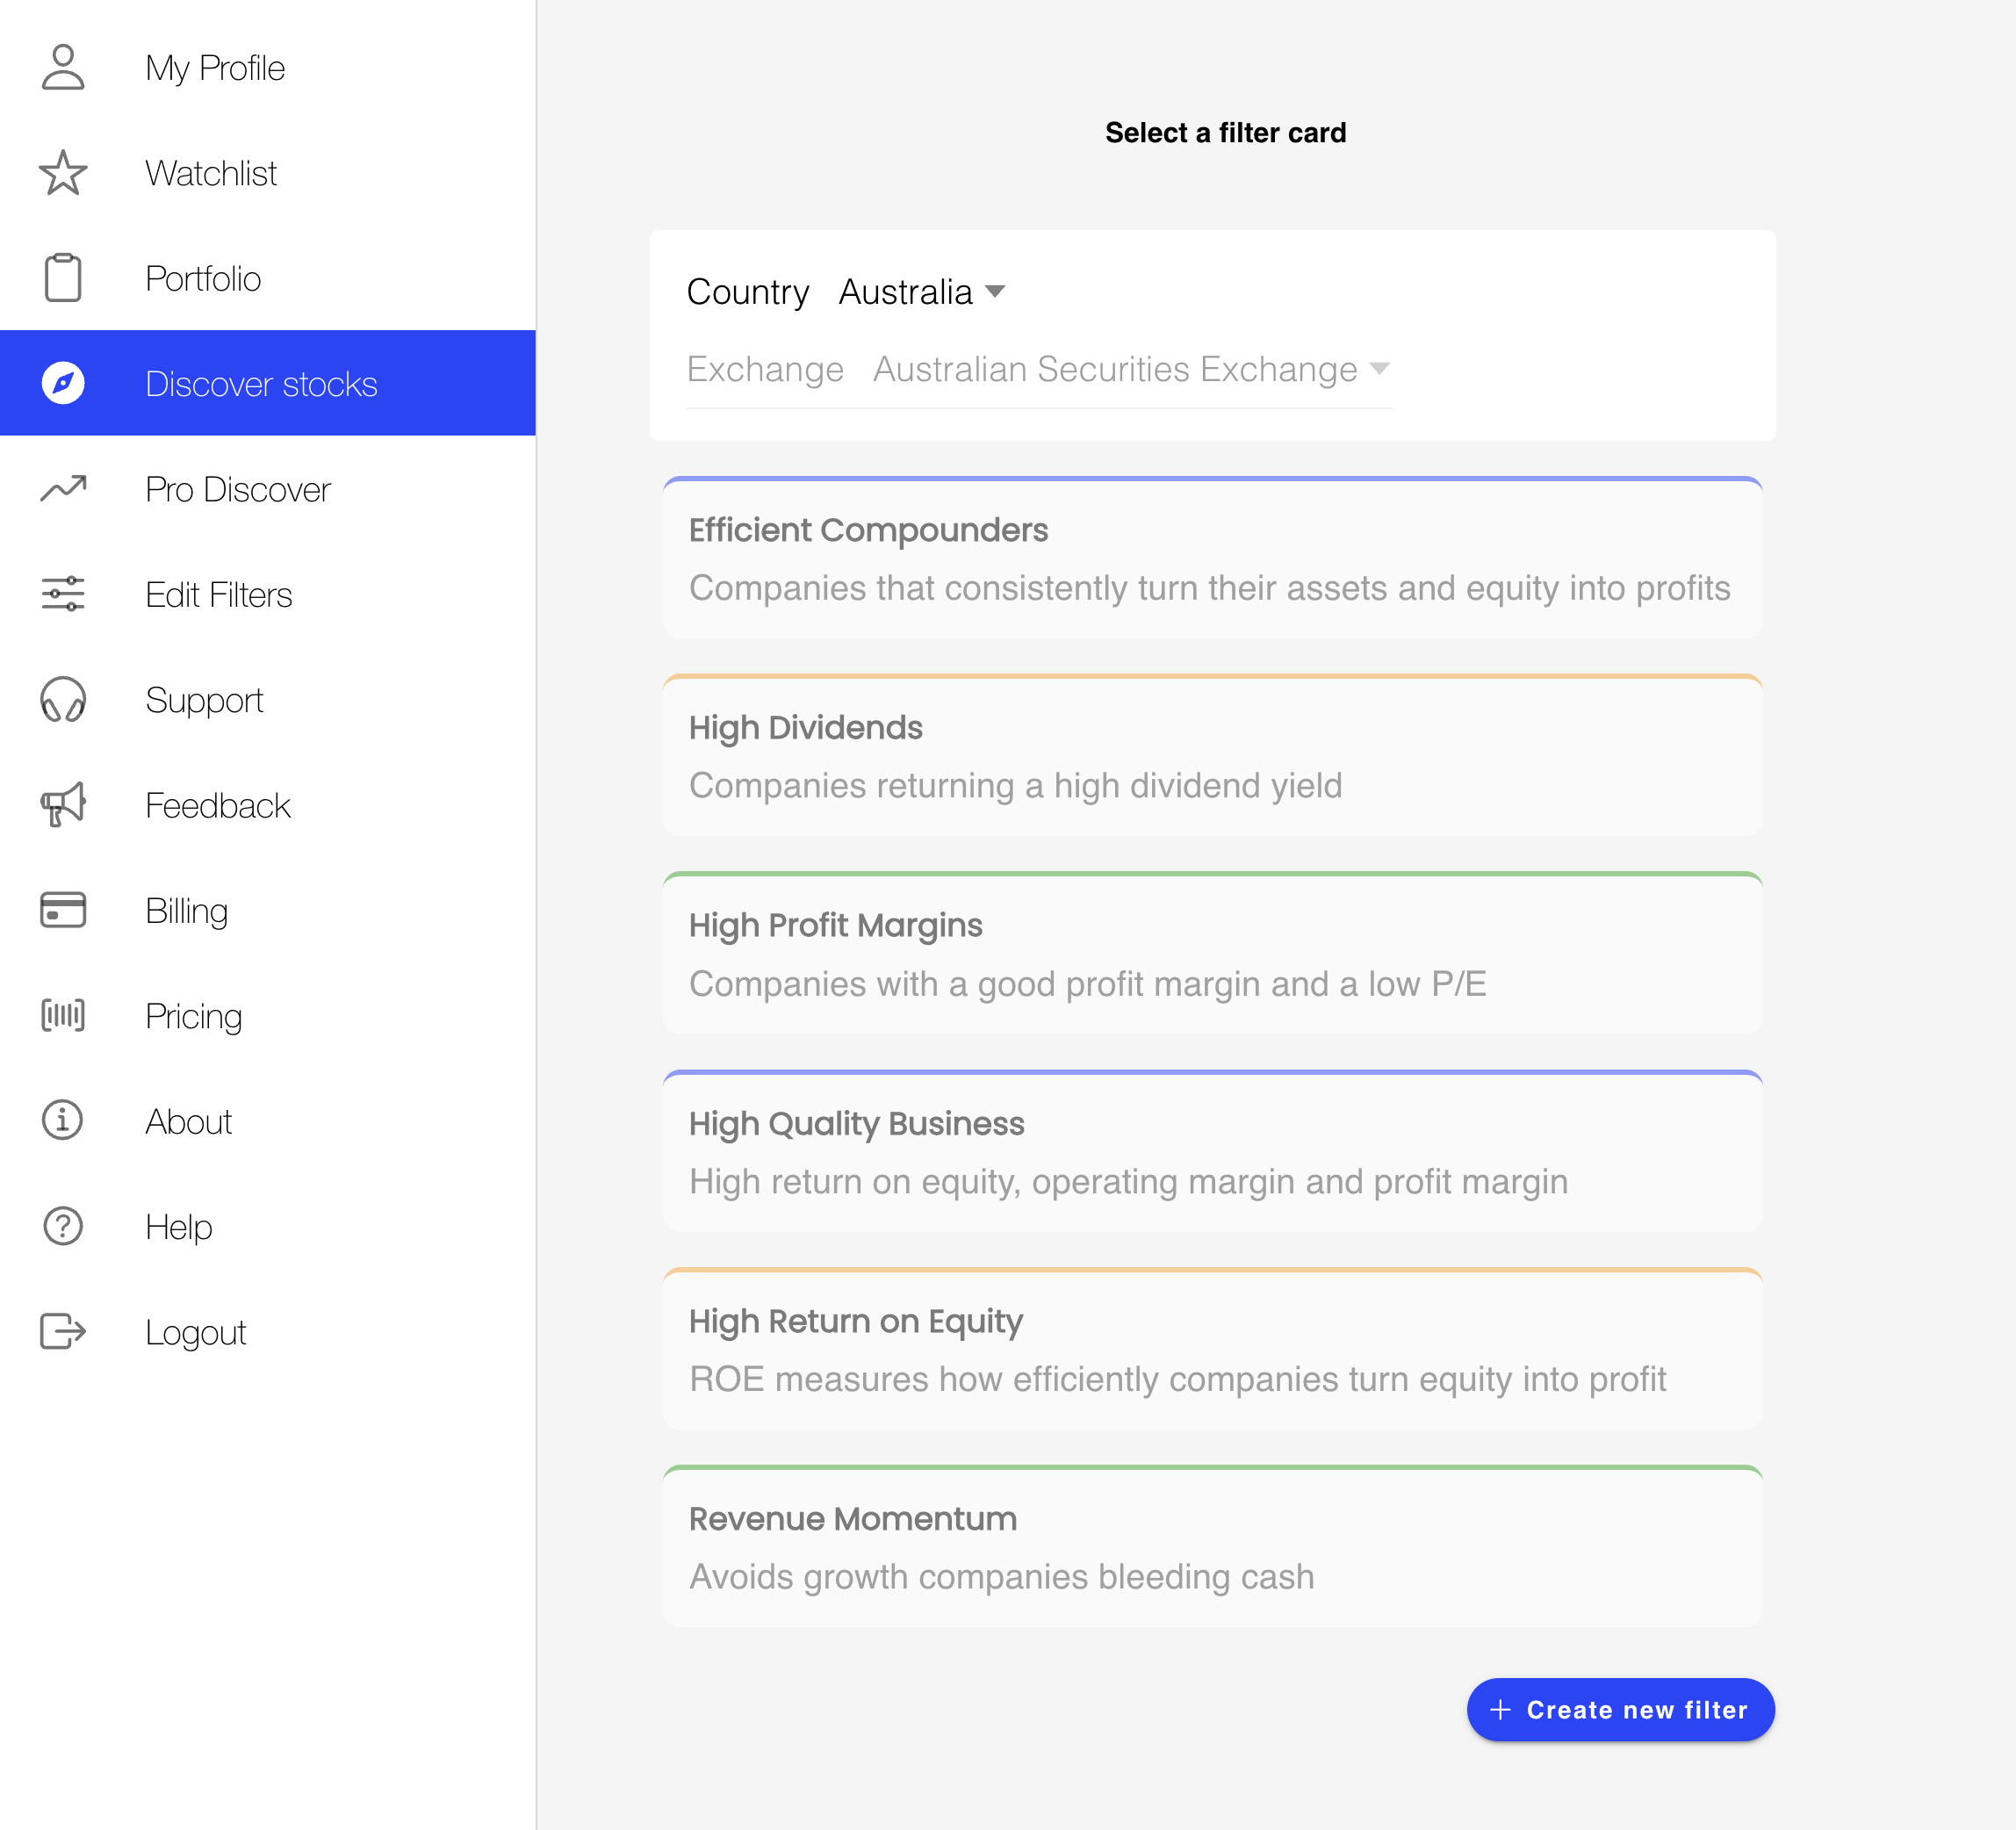
When you first enter the ‘Discover’ page you are shown a list of available filters as below.
If you would like to get a look at how Equishark can be used click on the ‘Go to tutorials button’ and select the tutorials you are interested in.
Below this is a list of available filters. Clicking on a filter such as the ‘Dividends AUS’ filter, will cause a list of those stocks that match the filter to be displayed.
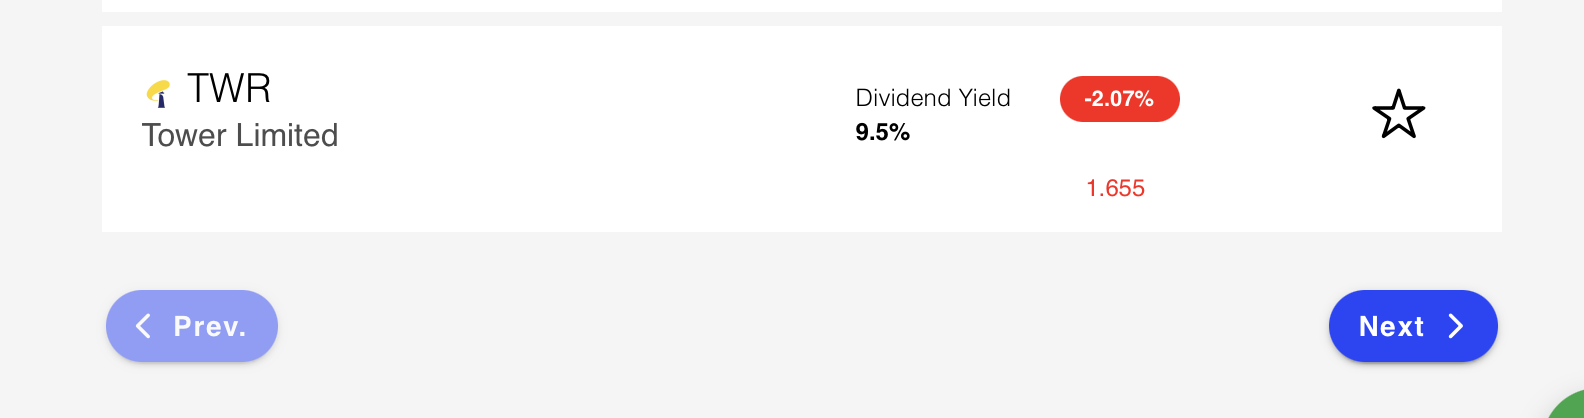
NOTE: When there are more stocks than will fit on a page, ‘Prev’ and ‘Next’ buttons can be used to view additional stocks.
Showing Stock Details
To see more information on a particular stock simply click on the stock name. This will bring up more detailed information on that stock.
Price Chart
At the top of the page is the price chart, this is the stock price over time.
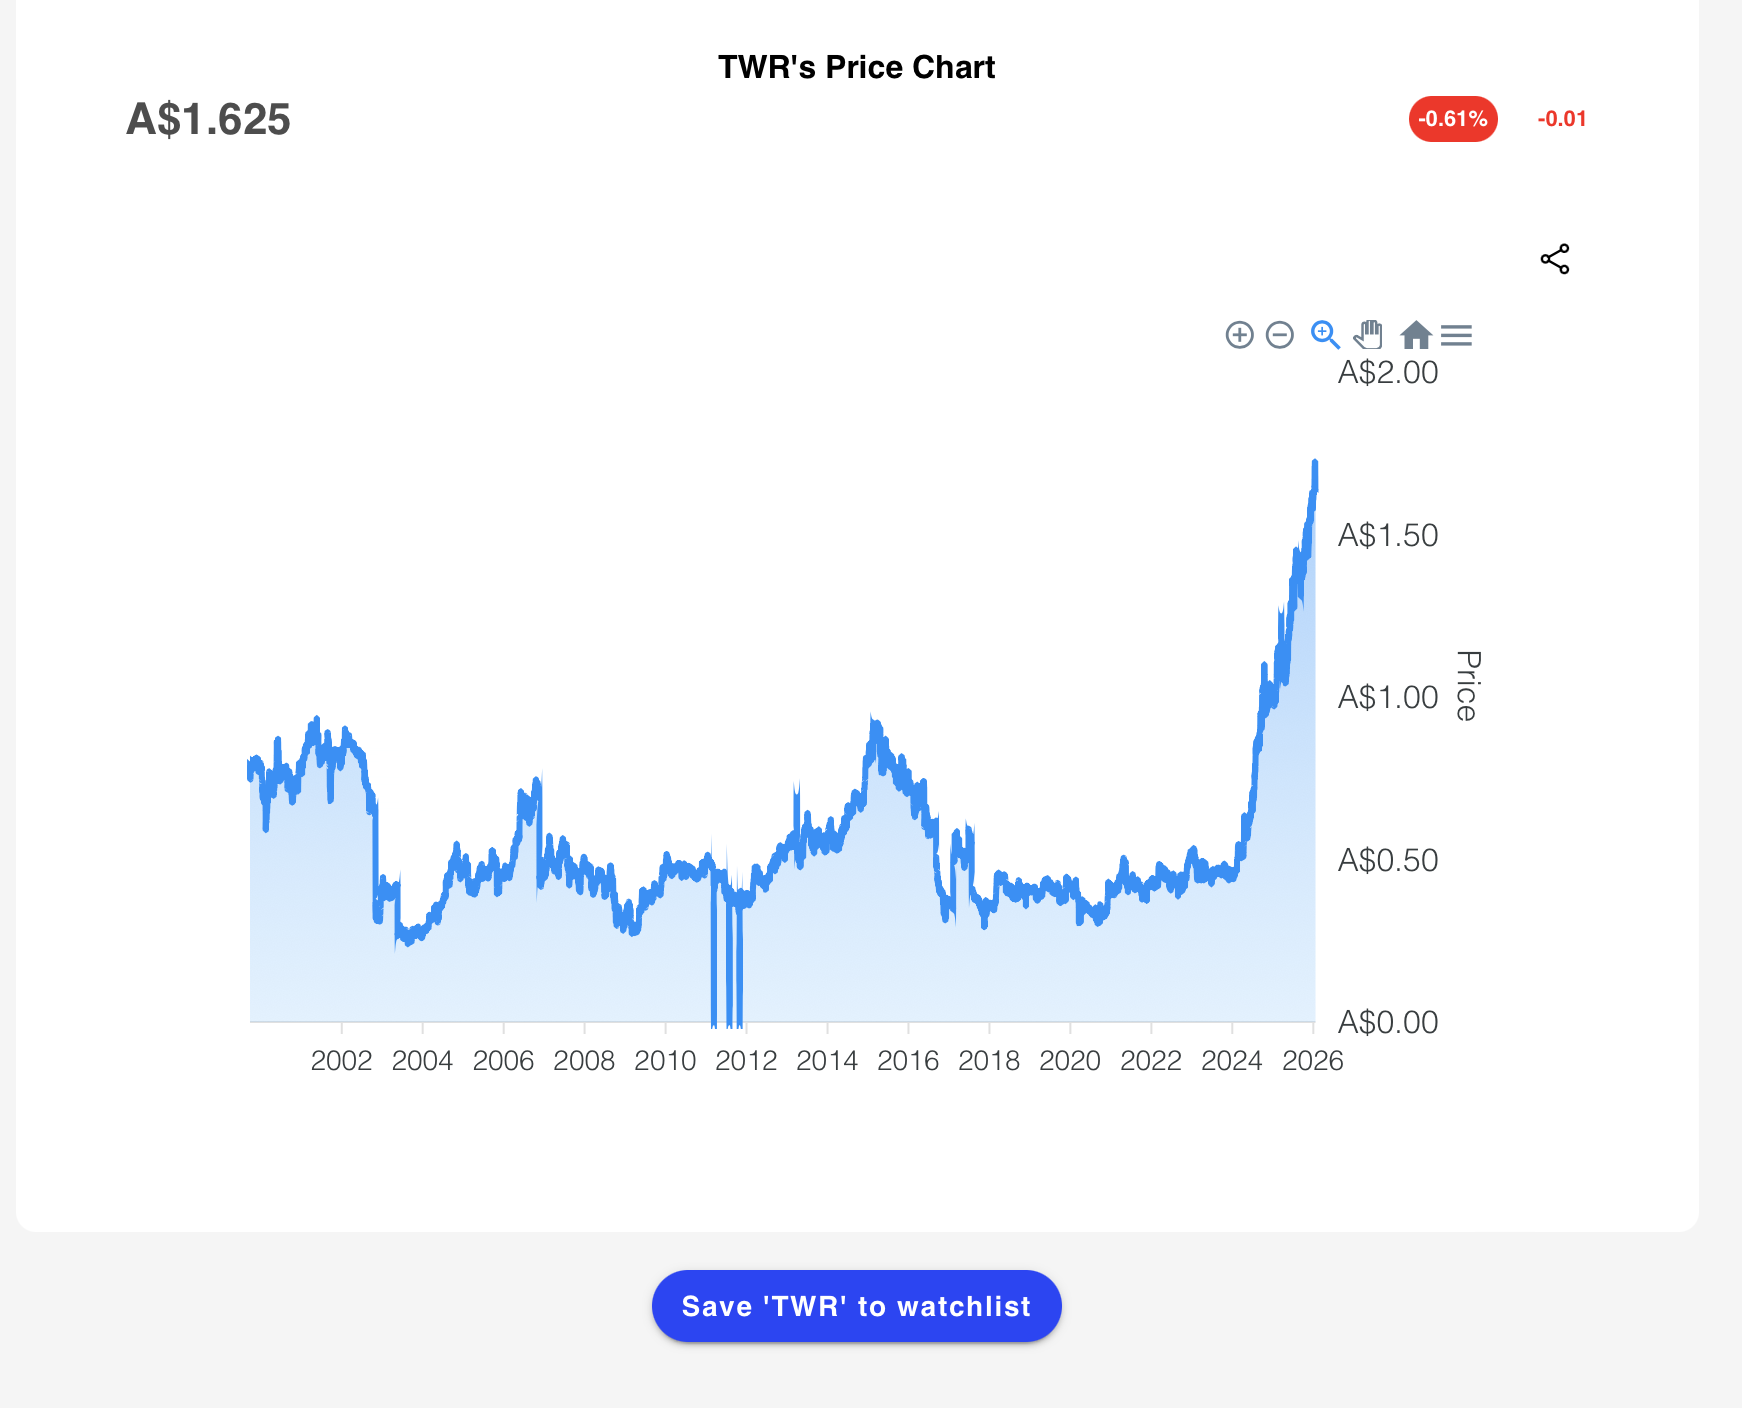
To zoom into any part of the chart that you want to see in greater detail simply click on the part of the chart you want to start at and drag to the part you want to finish at. This section will then be expanded.
Alternatively you can press the ‘+’ button at the top of the chart to zoom in or the ‘-’ button to zoom out.
Description
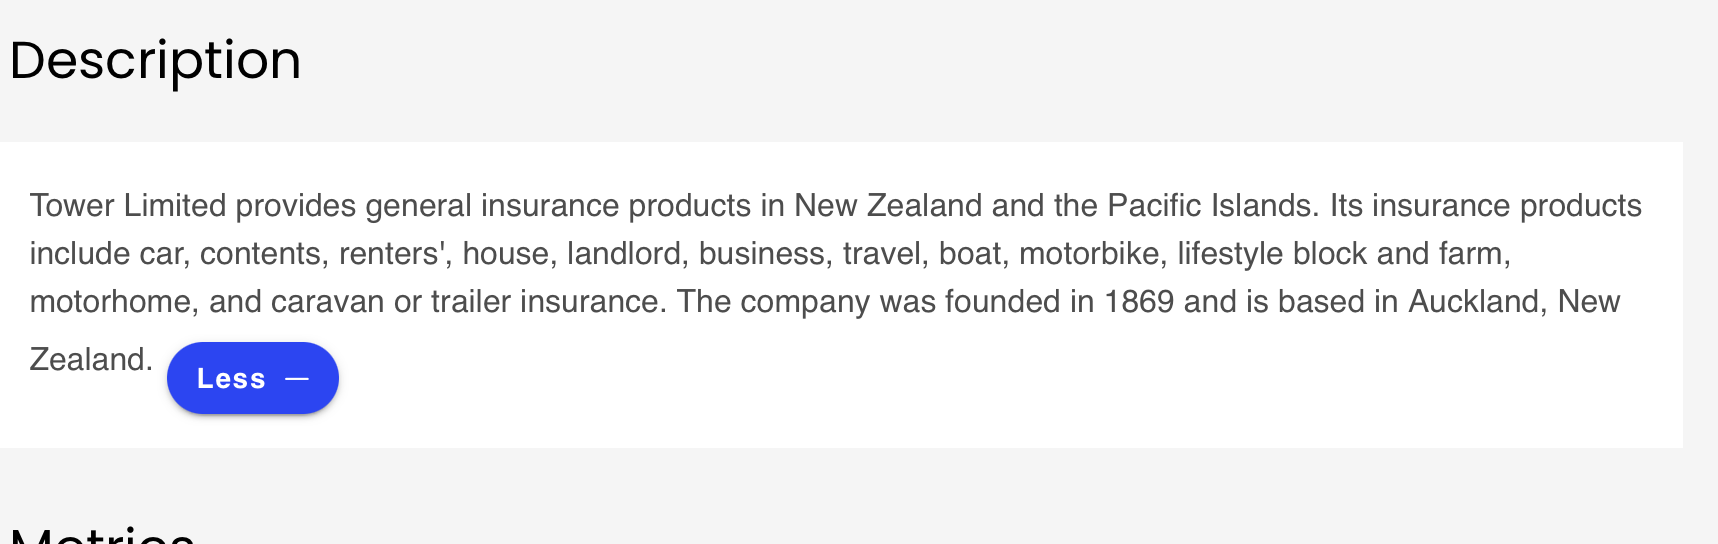
After the price chart is the company description, a brief description is displayed, this can be expanded by clicking on the ‘More +’ button.
Metrics
This section displays a subset of the company’s metrics. To view more metrics click the ‘Show More’ button.
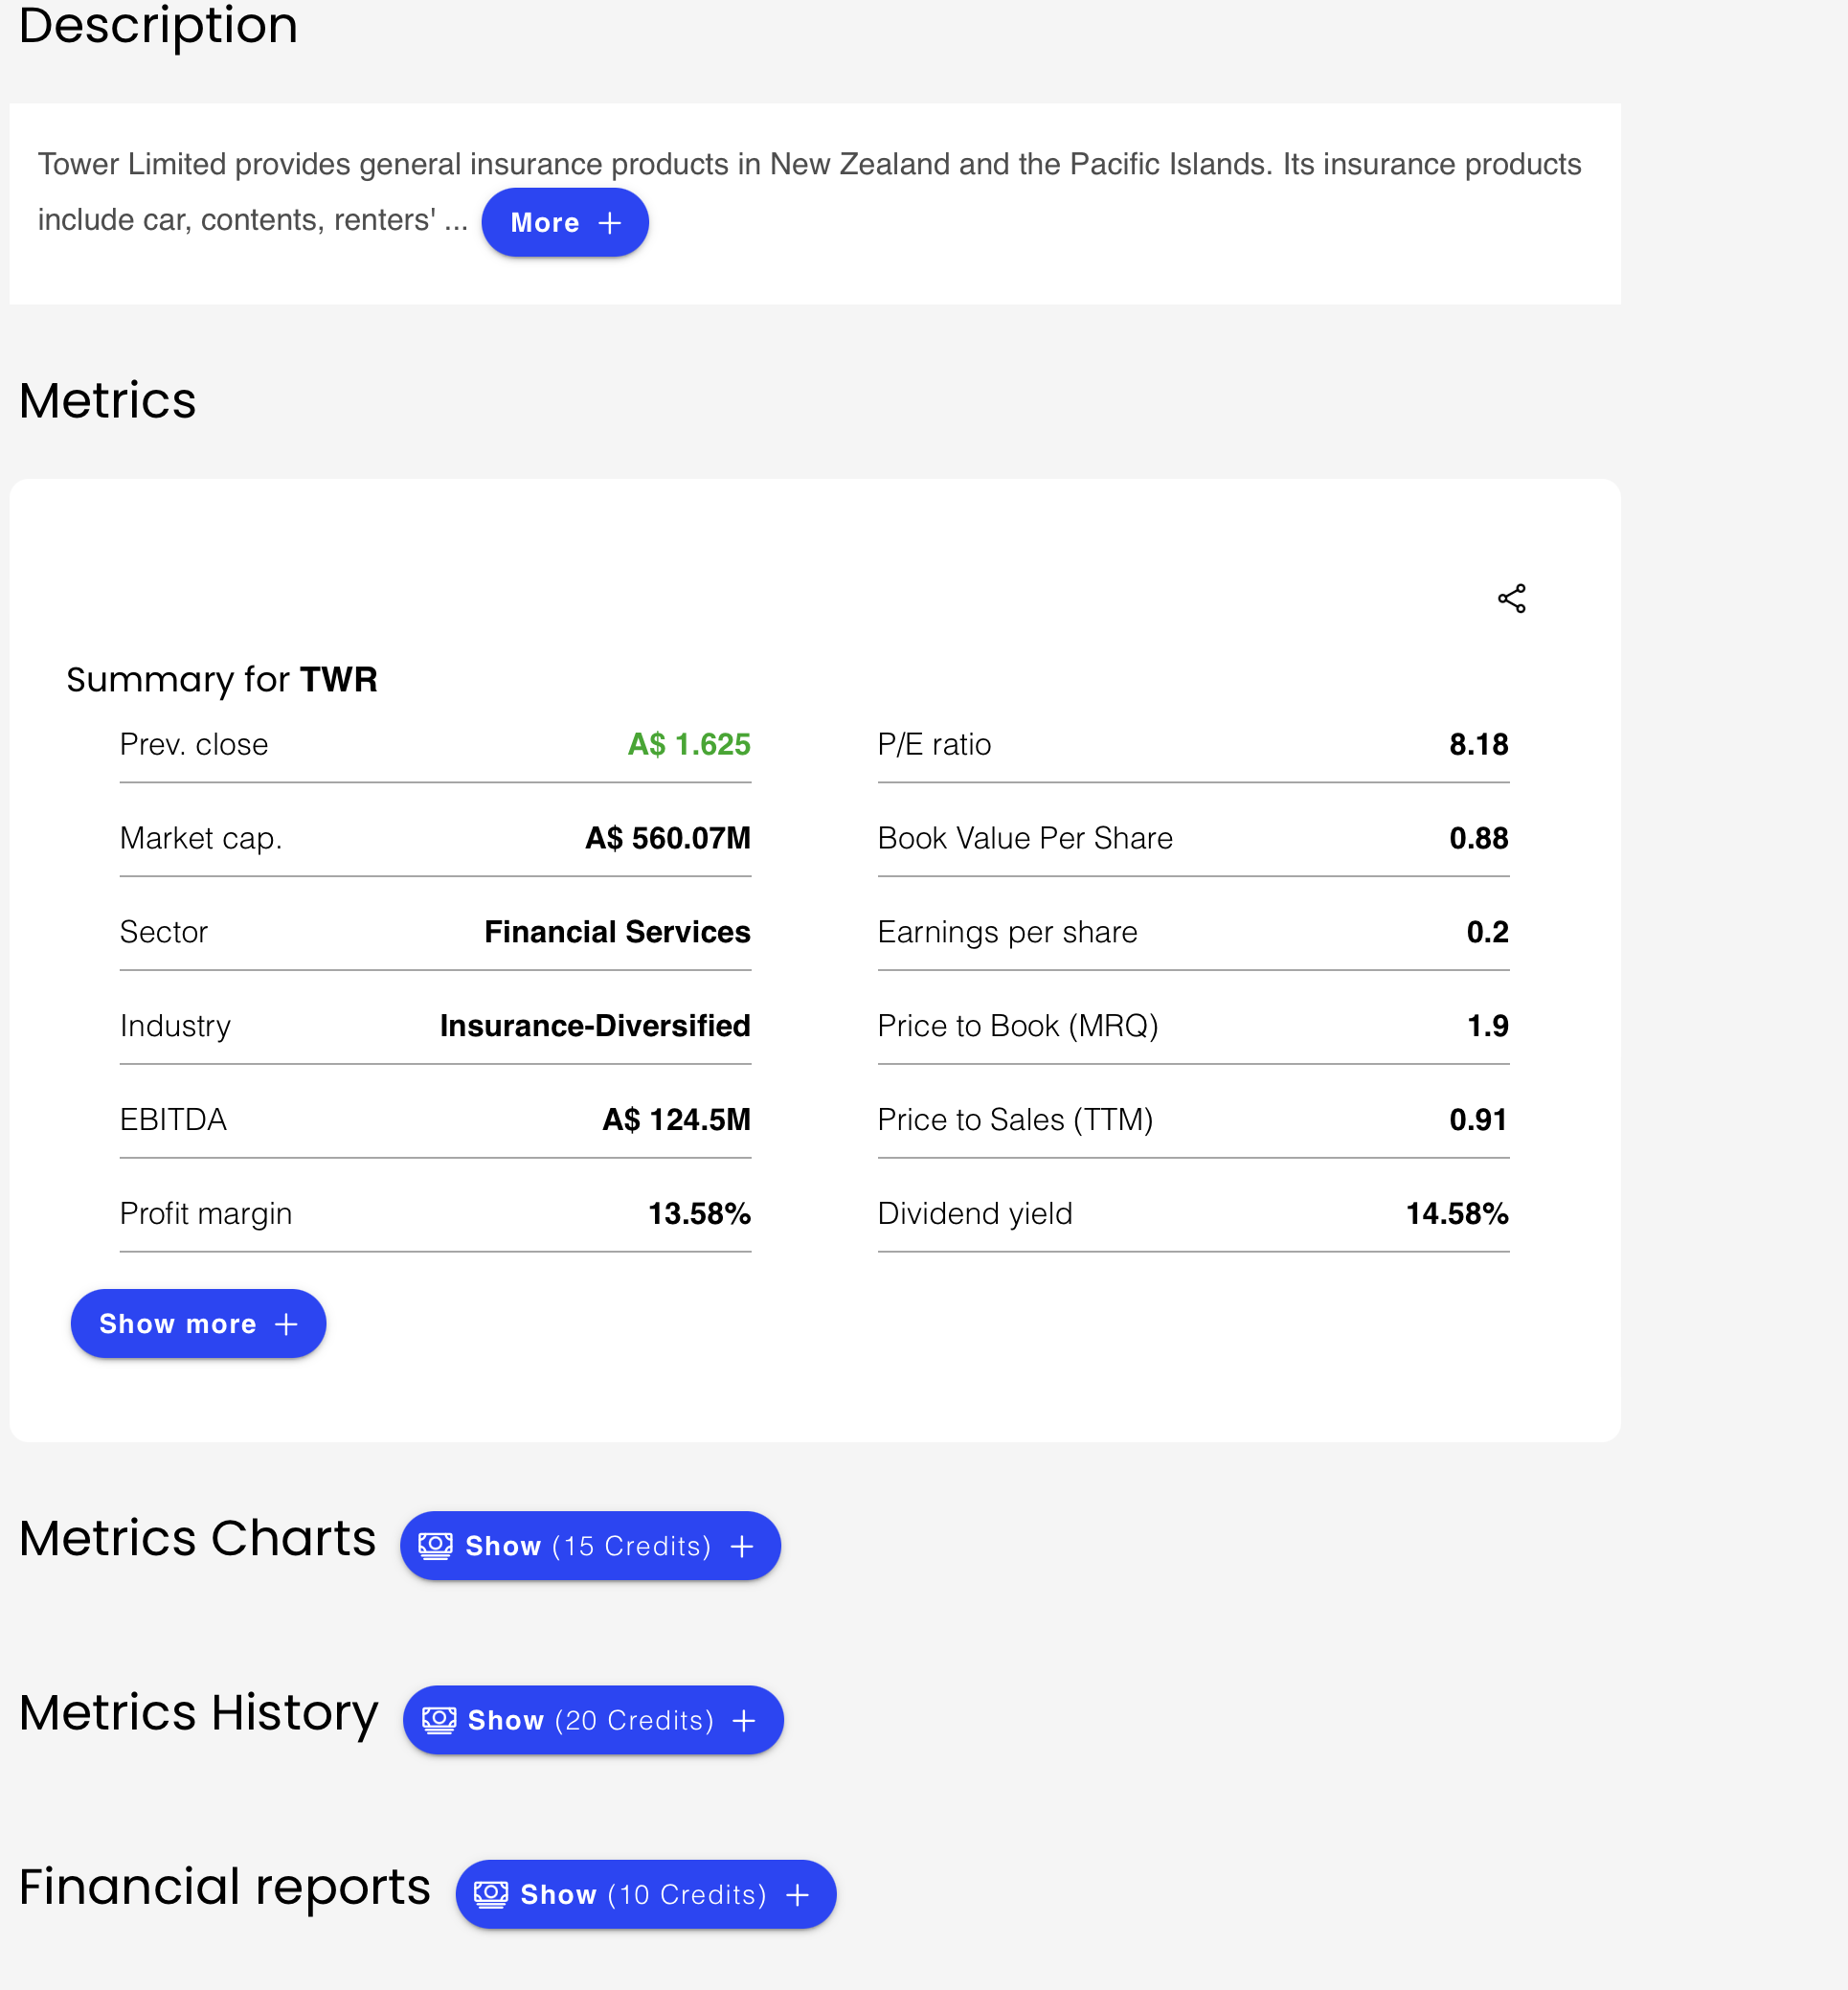
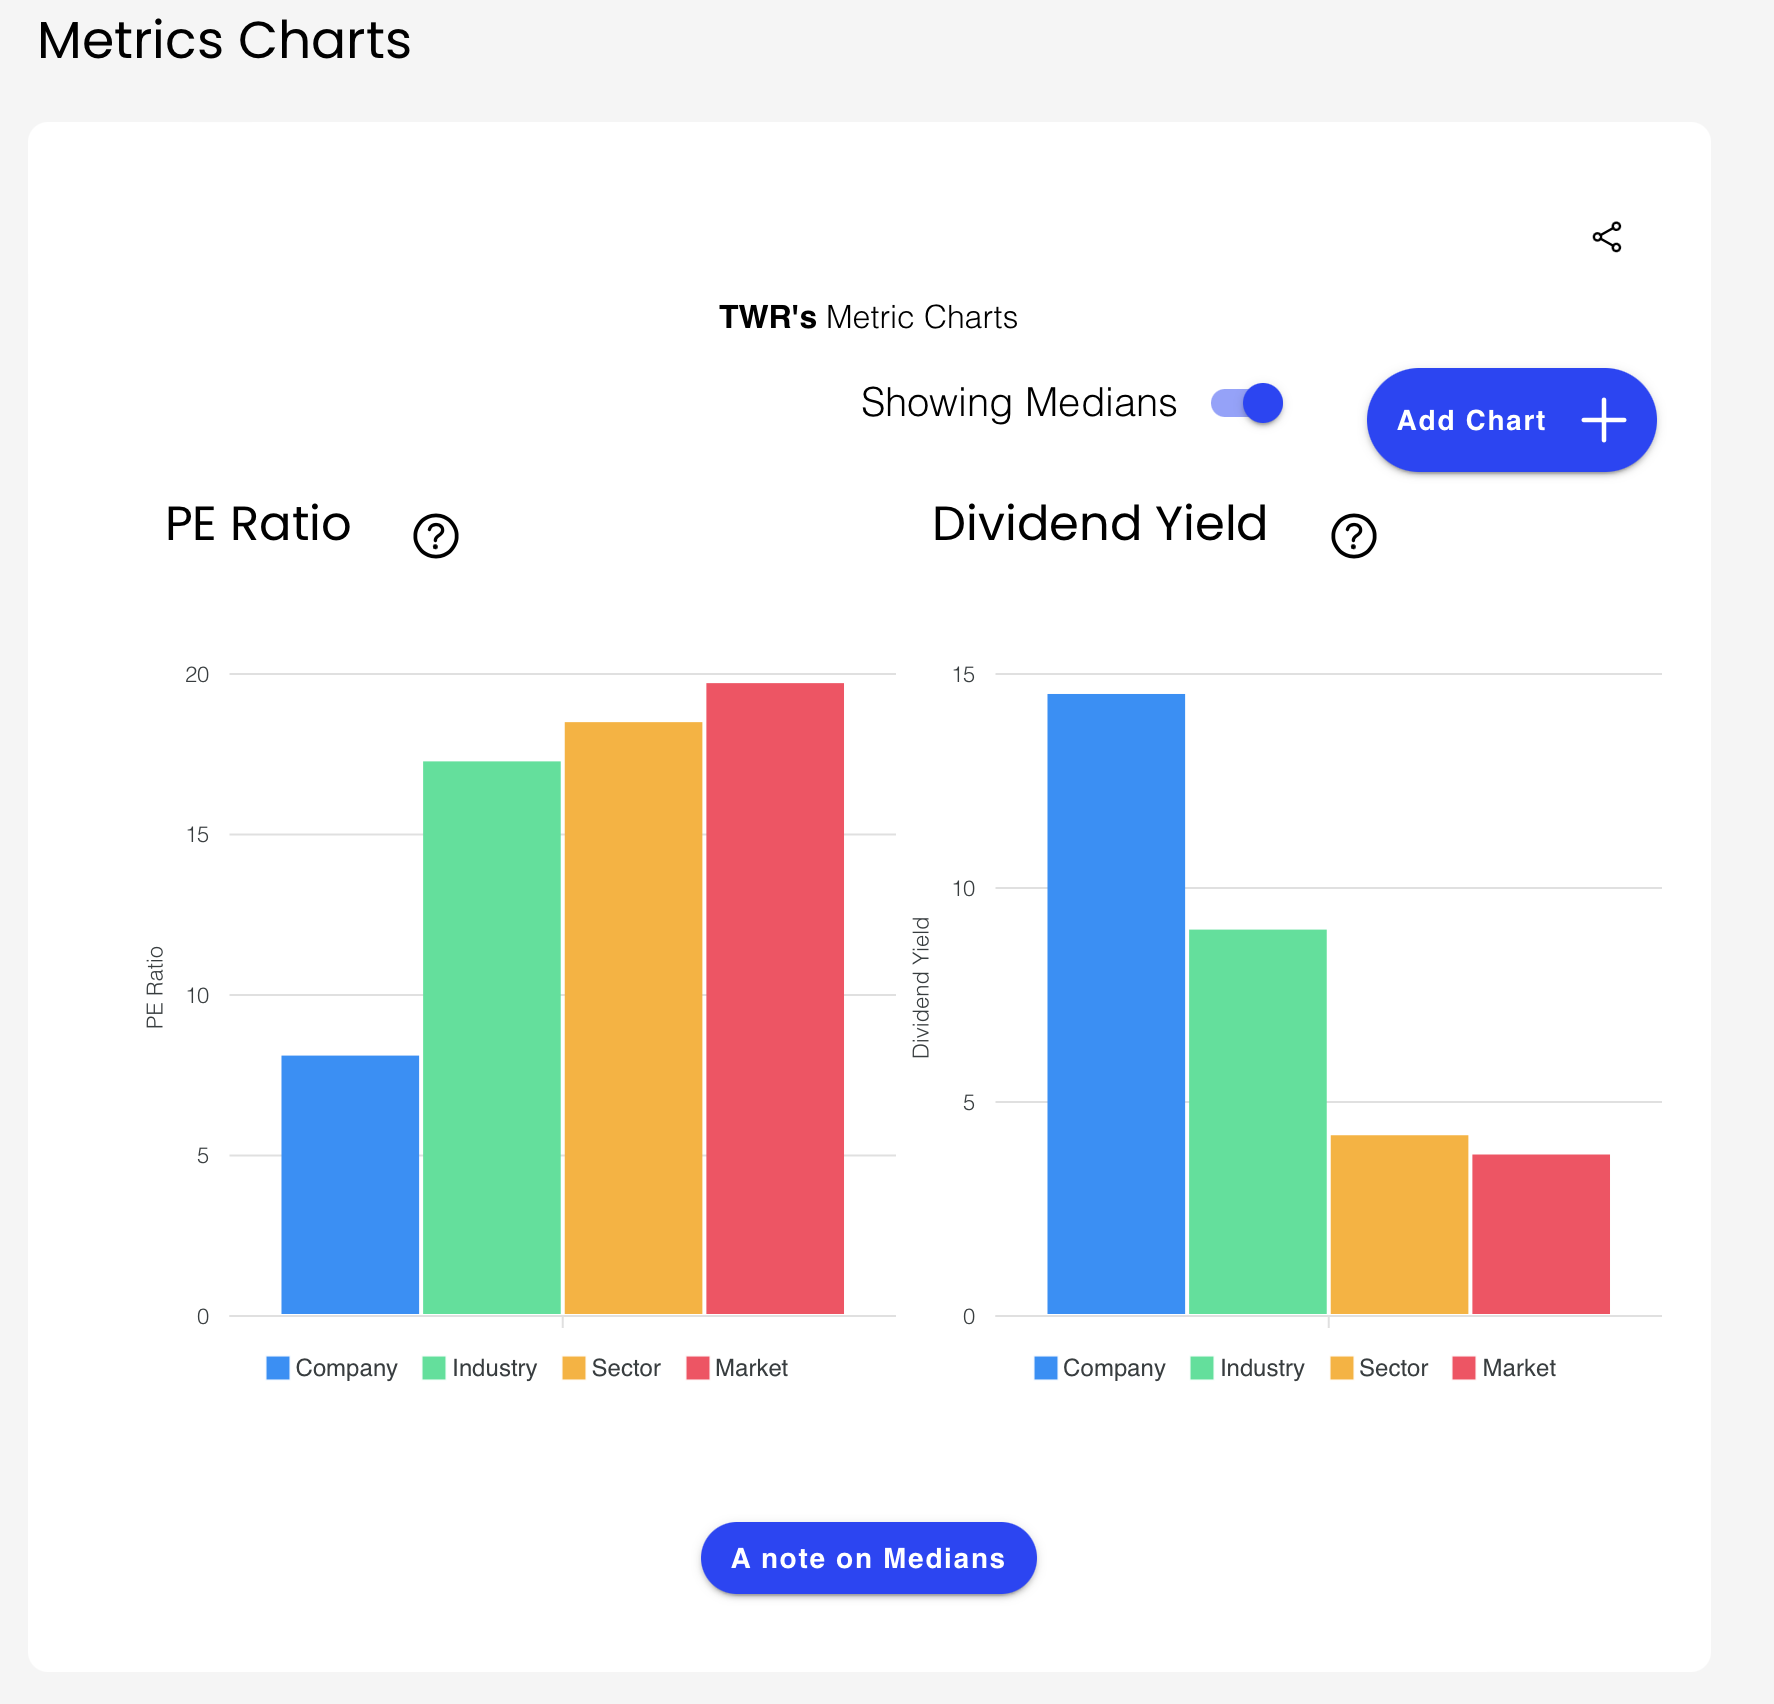
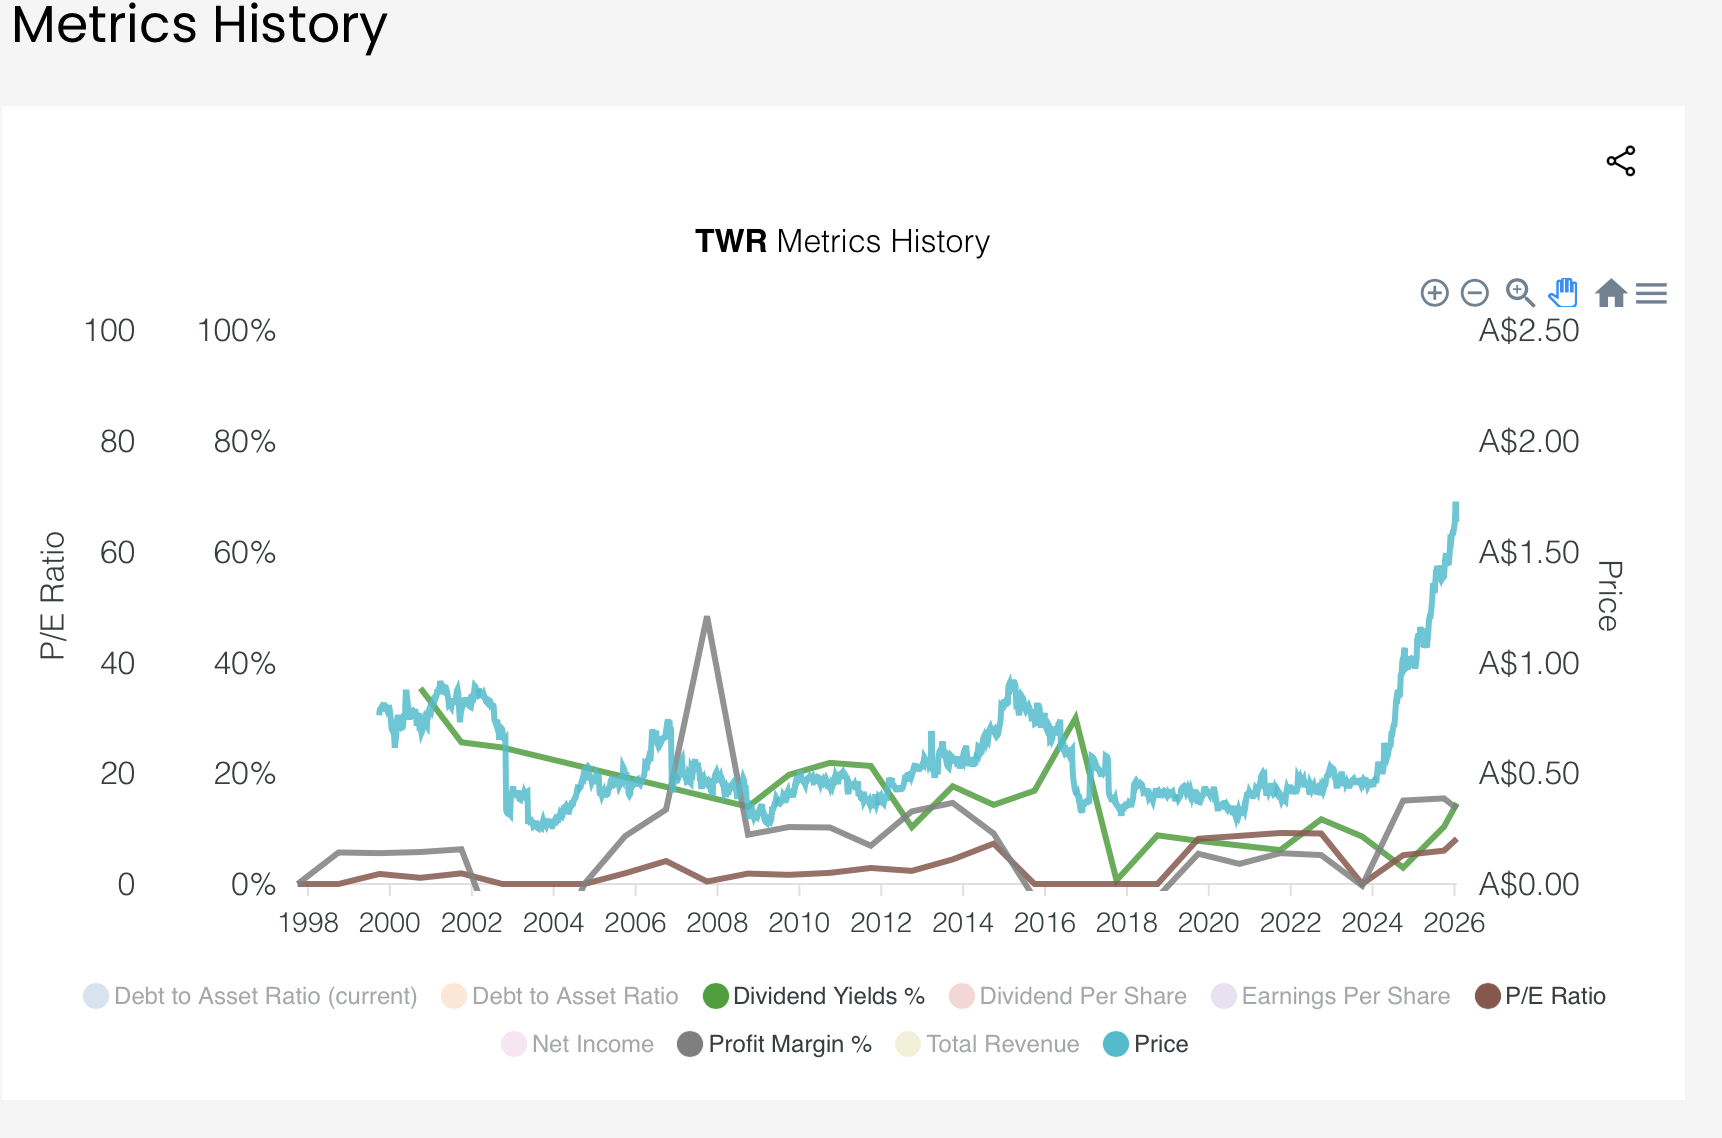
Below the ‘Metrics’ you can get additional information about the metrics, click on the heading to show these.
NOTE: some of these will require you to spend some of your credits.
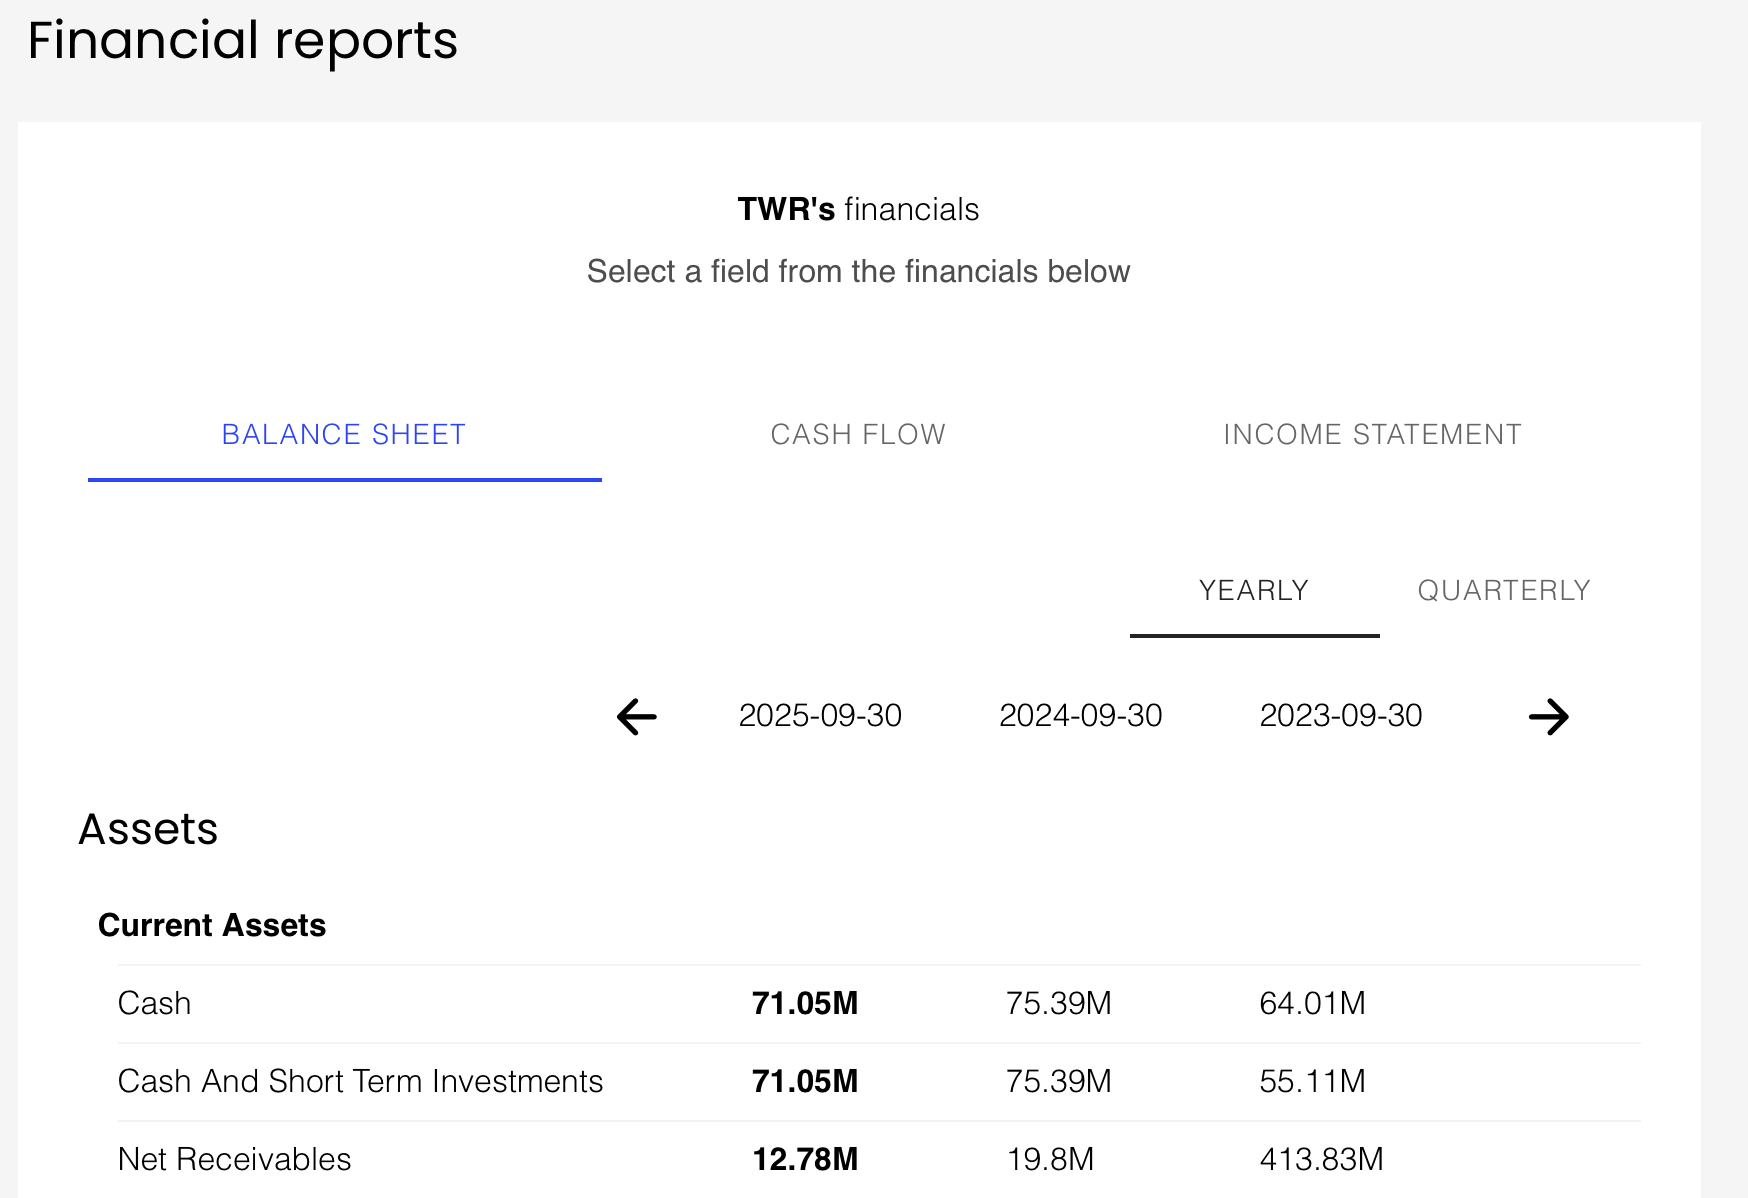
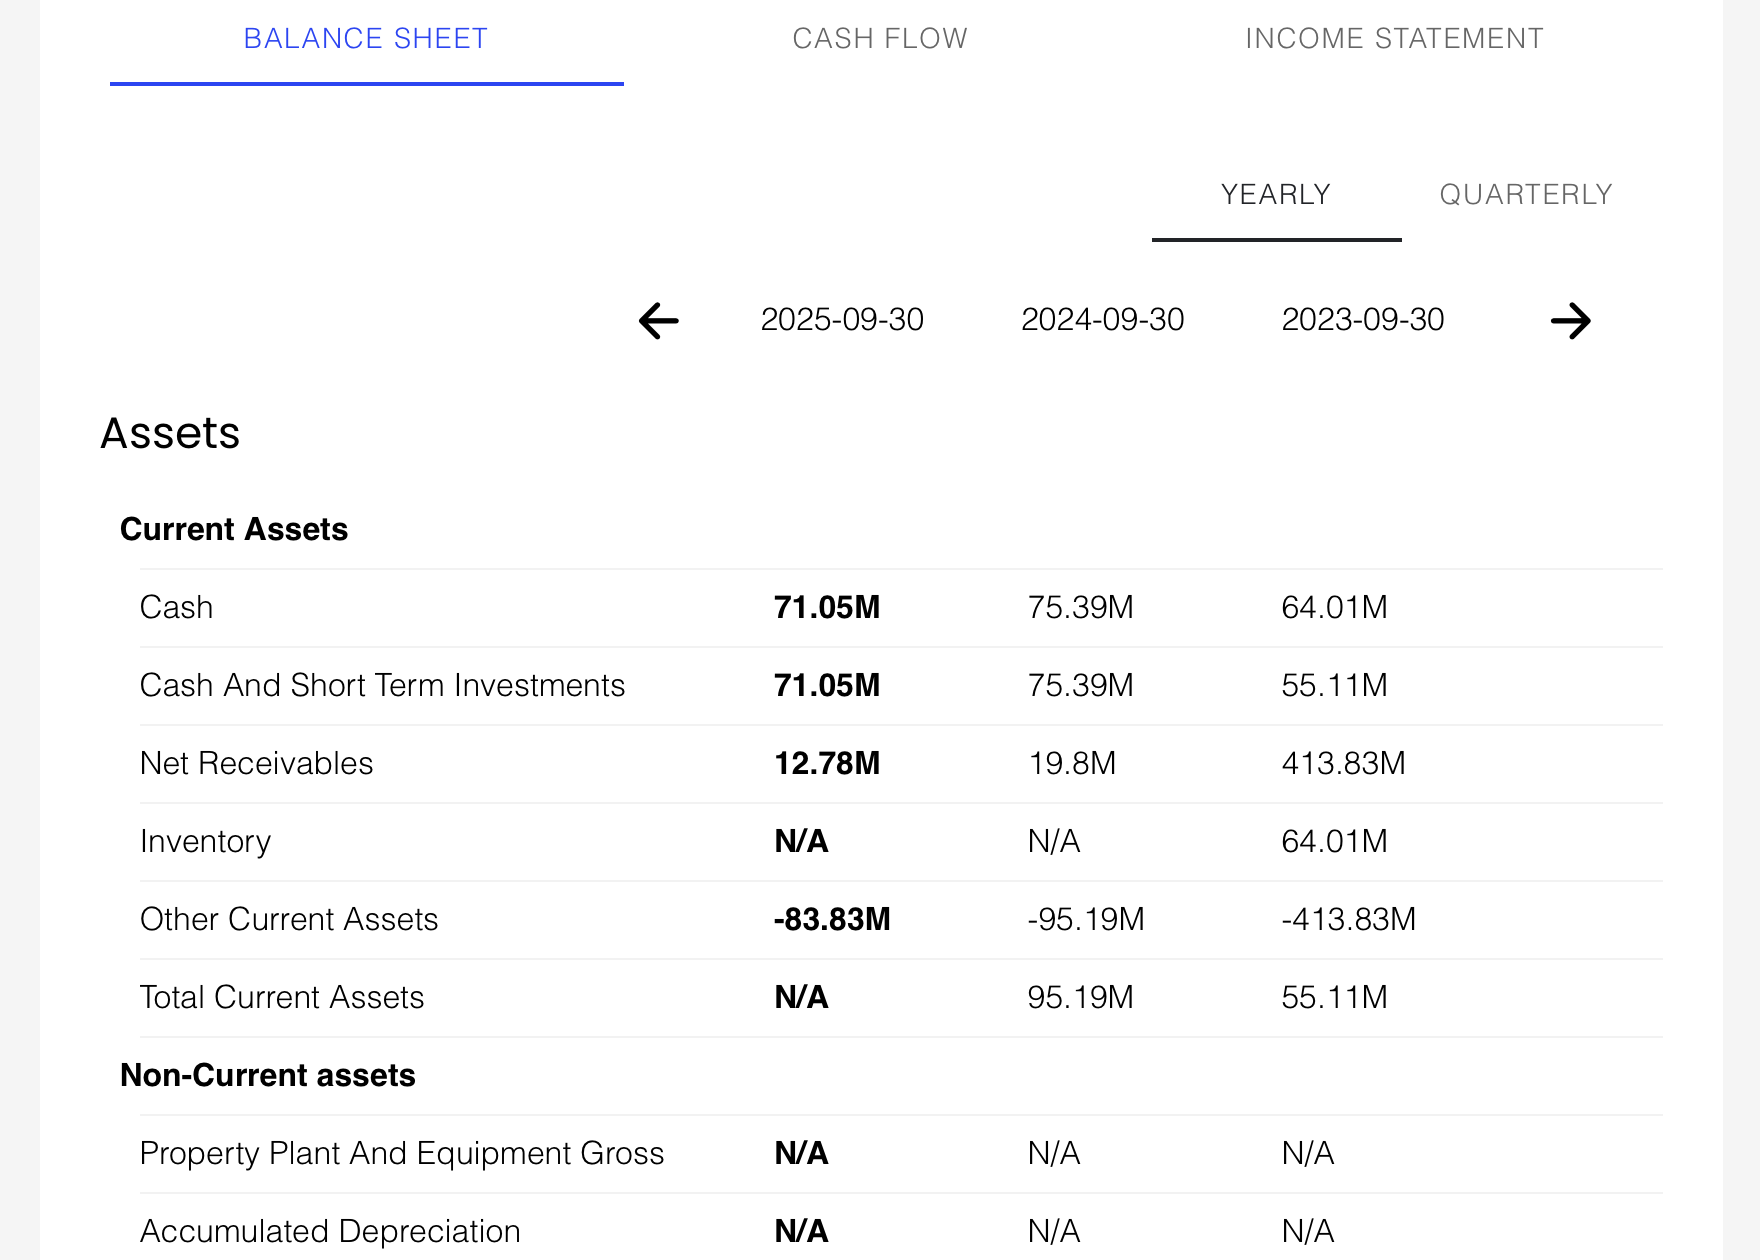
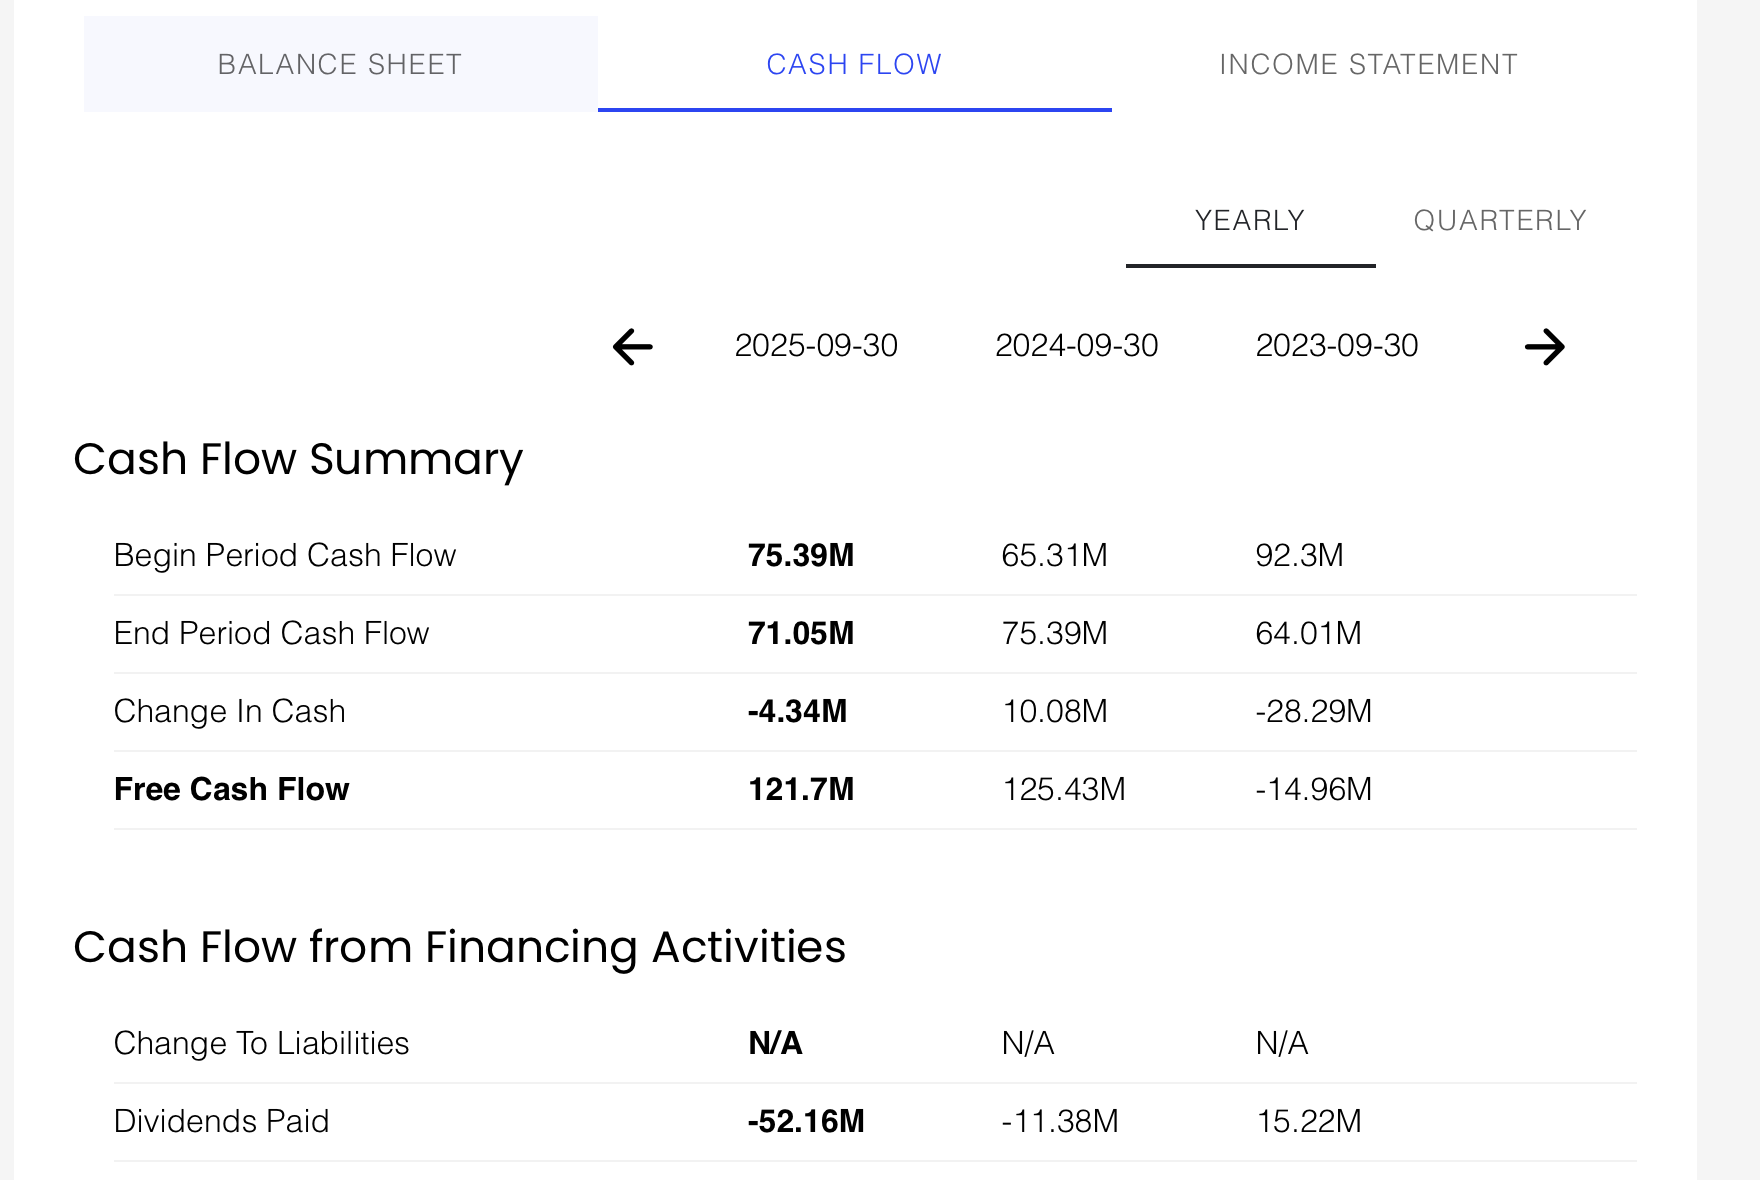
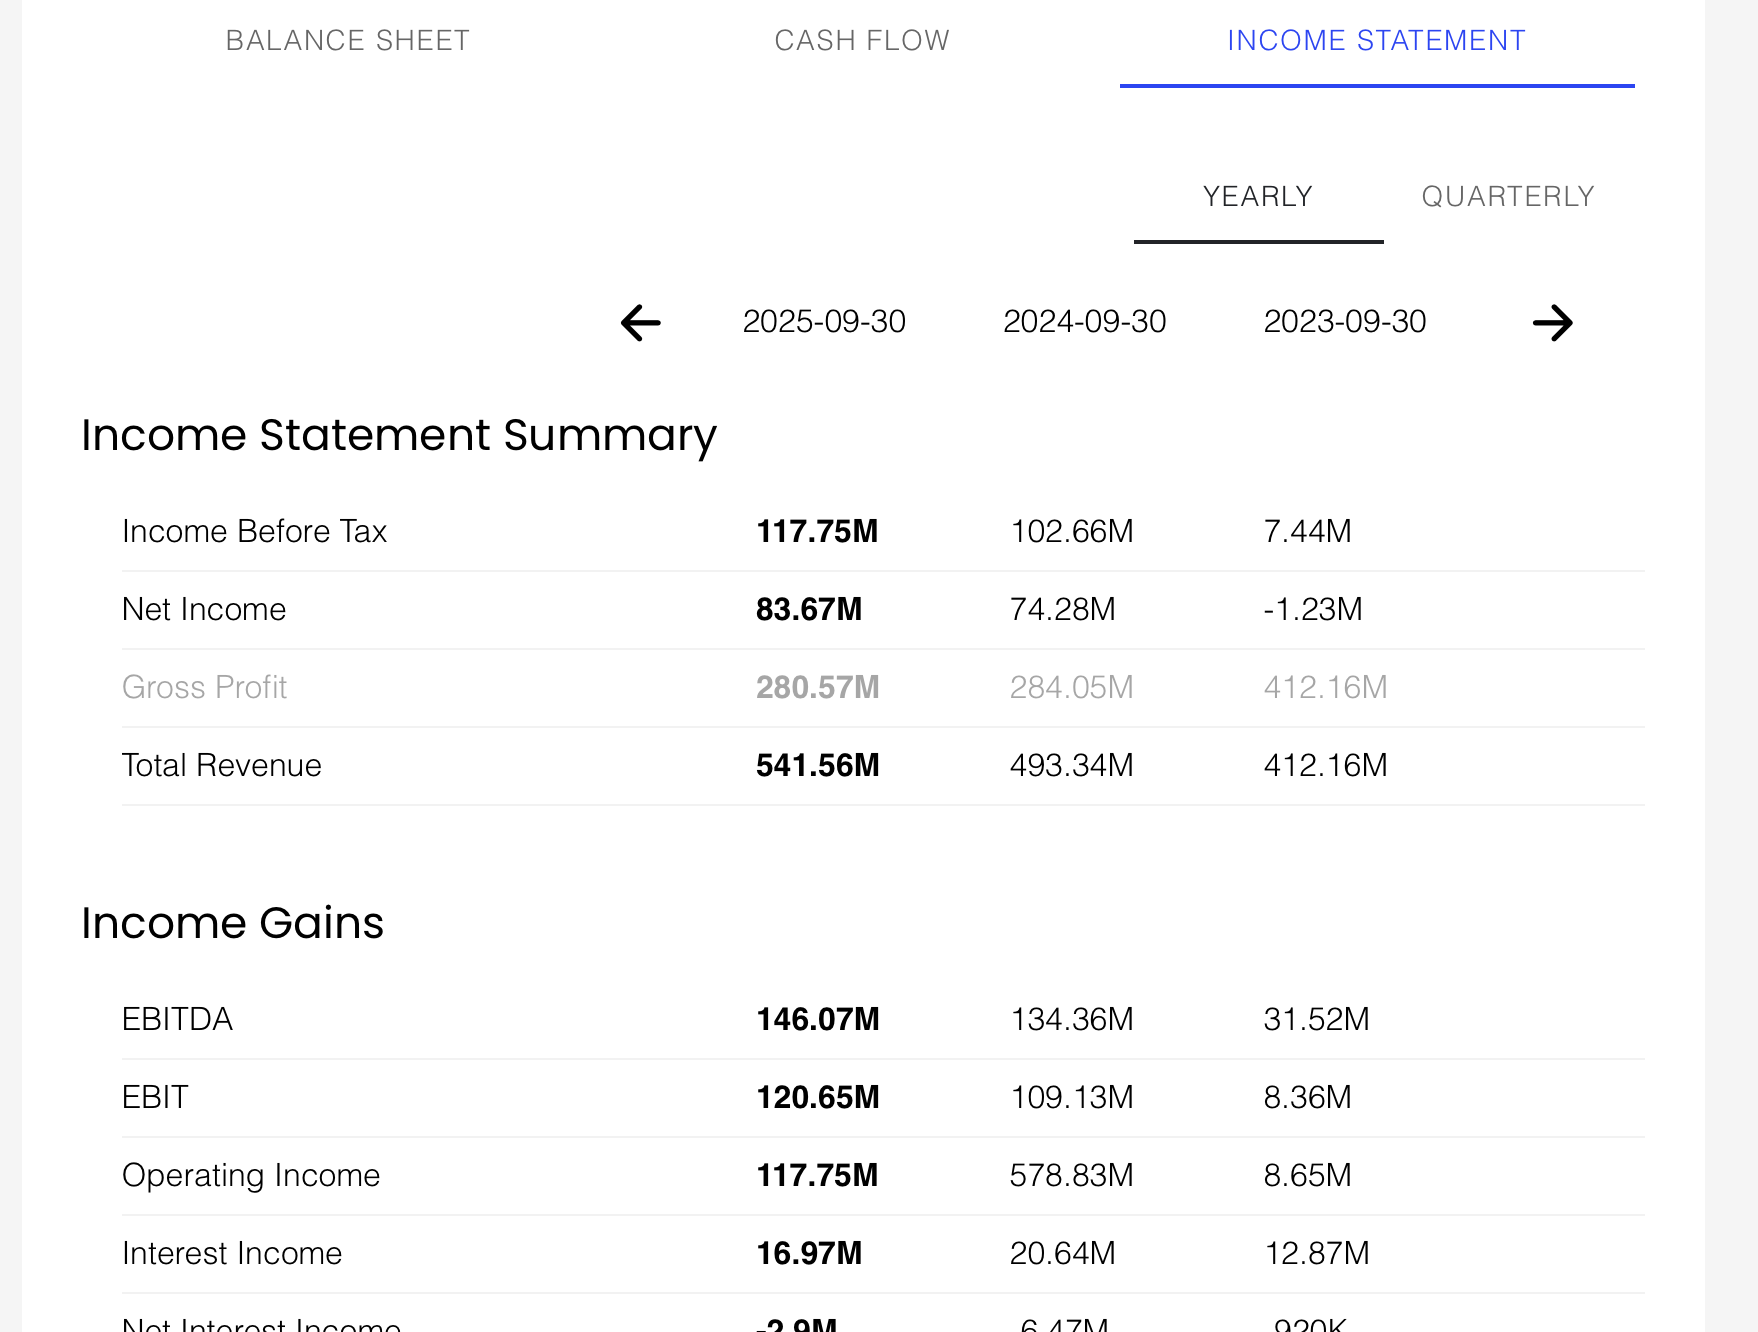
The Financial reports display different groups of financial data for the company. Click on the tab at the top of the tile to select the type of financial data you are interested in. Data can be displayed quarterly or yearly, simply press the button corresponding to the time period you are interested in.
Adding Stock to Watchlist
Watchlists are groups of stocks you are interested in and want to keep an eye on. You can have as many Watchlists as you find useful, each Watchlist has a unique name.
To add a stock to one of your Watchlists, click on the star next to that stock and the ‘Add to Watchlist’ tile will be displayed.
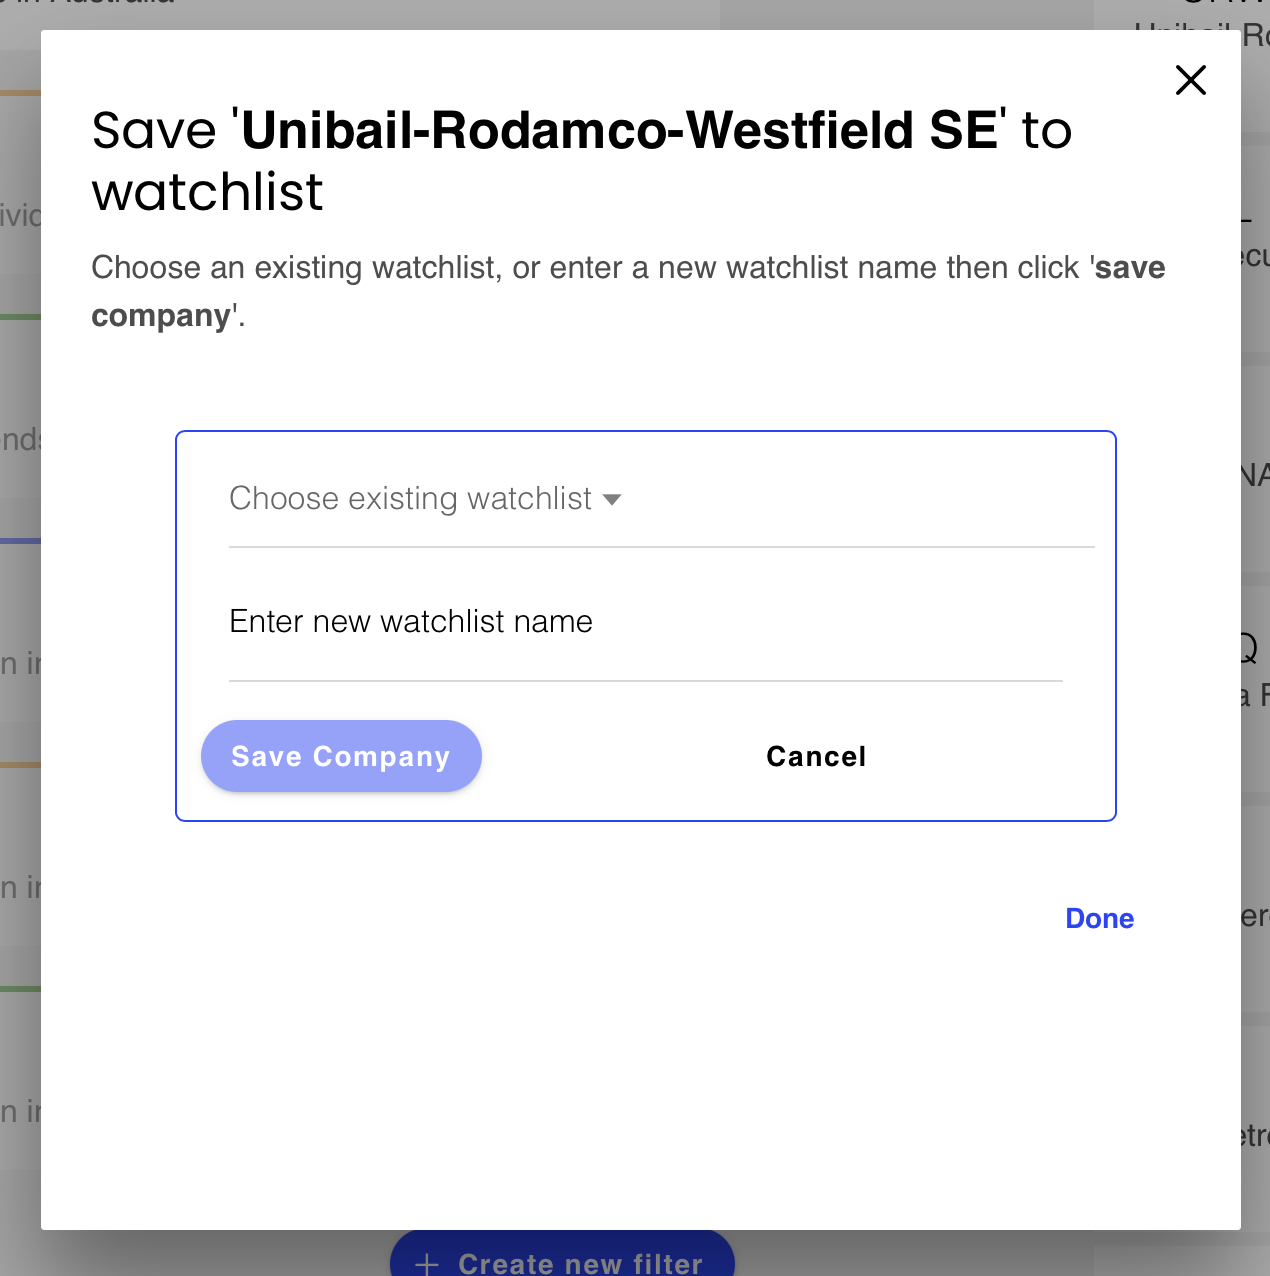
Select the Watchlist you want to add the stock to from the dropdown and press the ‘Save Company’ button. Repeat this process for all the Watchlists you want to add this stock to and click on ‘Done’ when you’re finished.
Creating Customised Filter
To create your own customised filter press the ‘+ Create new filter’ button at the bottom of the page. This will cause the ‘Stock filters’ page to display. The ‘Filters’ section covers this in detail.