Free to start · No card required
TSX stock screener
Filter companies listed in Toronto on the fundamentals you choose. Set a range on each measure, then open any company that comes back and read its price history, financial statements and key metrics charted over time.
Equishark provides factual information about listed securities. It is not financial product advice — see our Disclaimer.
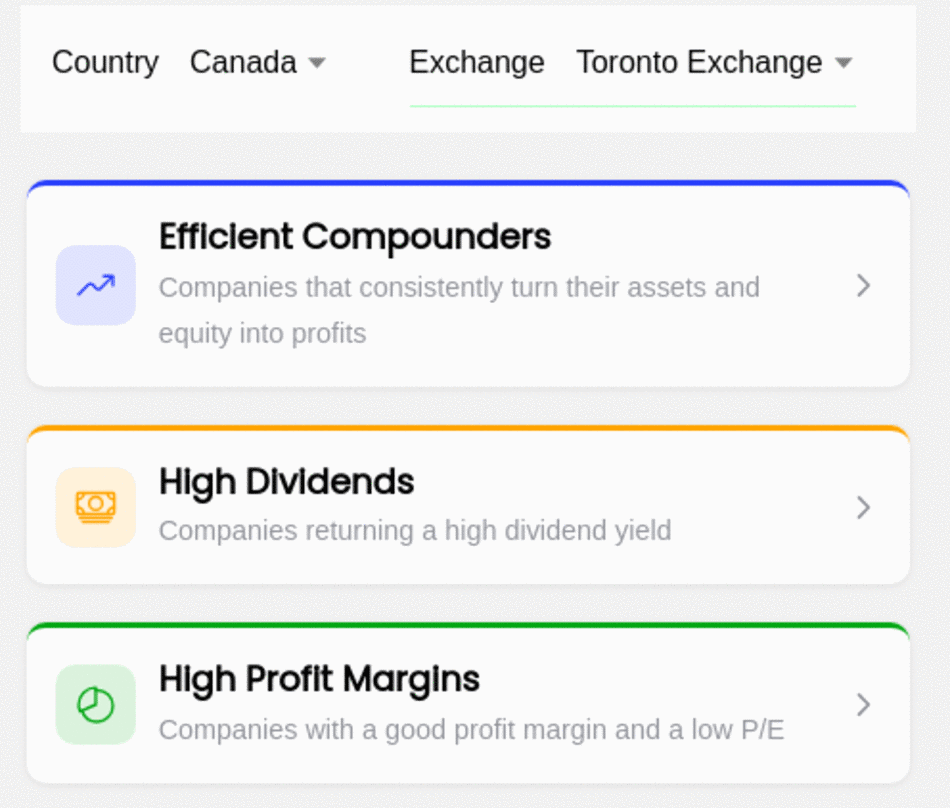
Build a screen from published figures
Pick any combination of reported numbers and set a range on each. The companies that match are listed with the figures you filtered on shown alongside.
- P/E ratio
- Price to book (MRQ)
- Price to sales (TTM)
- Dividend per share
- Earnings per share
- Book value
- Profit margin
- EBITDA
- Market cap
- Sector and industry
- Full time employees
- …and dozens more
Then read the company behind the number
A screen narrows a market down to a shortlist. The work after that is reading the companies on it, and every result opens onto the full record rather than a summary tile.
Price history you can interrogate
An interactive closing-price chart. Hover for the price on any date, drag across a period to zoom into it, and switch on reinvested dividends to see total return rather than price alone.
Metrics charted over time
P/E ratio, dividend yield, profit margin and debt to assets are each plotted as a series against the price, so you can see whether a margin has been widening or a yield is where it usually sits. A number in isolation tells you far less than the shape of the line it sits on.
The statements themselves
Income statement, balance sheet and cash flow, quarterly or yearly, as reported. Each metric can also be set against its industry, sector and market medians, so a figure can be read against the company's peers rather than in isolation.
The price chart, company description and metric summary are free to read. The charted series and the financial statements use credits, and you are given some to start with — see pricing for what they are and how they are spent. Companies you want to follow can be kept in a watchlist and holdings tracked in a portfolio, including backdated trades.
Three things worth knowing about screening Canadian listings
Toronto has some characteristics that change how a screen reads. None of them are obstacles, but they are worth knowing before you interpret a result.
A Toronto ticker is not always what it looks like
Toronto lists Canadian Depositary Receipts of US megacaps under their US tickers — AAPL, AMZN, AMGN, ABNB. A CDR holds a fraction of a share, so a per-share ratio built from the underlying company's accounts describes something the receipt holder does not own. We leave them out of screener results rather than show you a figure that looks like a bargain and is not. Preferred shares are excluded for the same reason.
Reporting currency is not always CAD
Of the Toronto companies we hold financials for, roughly a third report in US dollars rather than Canadian — common in mining and energy. Any ratio built from a reported figure inherits that currency, so it is worth checking which one a company reports in before comparing two of them directly.
The index is concentrated
Financials, energy and materials make up a far larger share of the Canadian market than of the US one. A broad screen will reflect that concentration, which is a property of the market rather than of the filter.
Common questions
Screen the TSX
Open the screener, pick a filter and see what comes back. No card, nothing to install.
Open the screener